In a time where the average enterprise generates large amounts of data on a daily basis, unless the data paves a path to gleaning valuable insights, on its own, data does not hold much value. This is where Artificial Intelligence helps aid data analysis, exploration, find patterns in the collected information, predict future outcomes and make data more comprehensible for the user.
Microsoft’s Power BI is one such application that has broken new grounds in applying AI to Business Intelligence by means of NLP (Natural Language Processing), machine learning, and advanced analytics.
Microsoft announced enhancements to Power BI and PowerApps in their Microsoft Business Application Summit 2024 that included a host of powerful AI features related to Image recognition, Text analytics, the ability to generate machine learning models directly in Power BI without having to code and the integration of Azure Machine Learning. These features make AI more accessible for Power BI users, helping them easily harness data to discover hidden, actionable insights that help make better business decisions and maximize ROI.
In this article, we will look at the six key AI features in Power BI that you must start using right away.
5 Power BI AI Features to Use
1. AI Builder
AI Builder is a new no-code capability offered in the Power BI platform that allows users to automate processes and predict outcomes. It is a solution that can be implemented into current business processes and can be readily used upon implementation. With AI Builder, users can now add intelligence to their apps with no coding or data science prerequisites. AI builder is a handy feature to perform tasks like forms processing, object detection, text and binary classification.
2. Azure Cognitive Services
Azure Cognitive Services are pre-trained machine learning models that can obtain insights from large fragments of data. Their capabilities are integrated directly into Power BI in order to provide effective ways to extract information from a variety of sources such as documents, images, and social media feeds.
The embedded algorithms can parse through documents to identify information such as the names of organizations, people, and locations which can then be used as insights to make better-informed decisions.
Some key cognitive services available today in PowerBI are:
- Sentiment Analysis: Sentiment analysis in Power BI uses text analytics, text processing, part-of-speech analysis, word placement, and other NLP technologies to help you evaluate and score sentiments. You can use this measure customer sentiment towards your brand in social media, customer reviews, and discussion forms.
Once you give the text input, the function uses machine learning to generate a sentiment score between 0 and 1. 1 denotes the maximum possible positive sentiment. Languages supported include English, German, Spanish, and French.
- Key Phrase Extraction: Using this function, you can feed big chunks of unstructured text to the system and get a list of key phrases. Unlike sentiment analysis, this function can deliver better results if you provide text in bigger blocks.
- Language Detection: This function analyzes the input text and provides the ISO identifier and language name. It can be leveraged to evaluate data columns in which the language of the text in not known. Currently about 120 languages are supported.
- Image Tagging: This function supports tagging of 2000+ recognizable objects, living species, environmental settings, and actions. Tagging doesn’t follow any taxonomy or inherited hierarchies. Tagging goes beyond the main subject in the image and covers the surrounding objects.
These services are included in Power BI Premium and don’t need an Azure Cognitive Services subscription.
3. Key Influencers Visual
Key Influencers Visual is the new and also the first Artificial Intelligence (AI) powered visualization offered by Power BI. It analyzes data, ranks the factors that matter, and displays them as key influencers in order to help users understand the factors that affect a metric that is being evaluated.
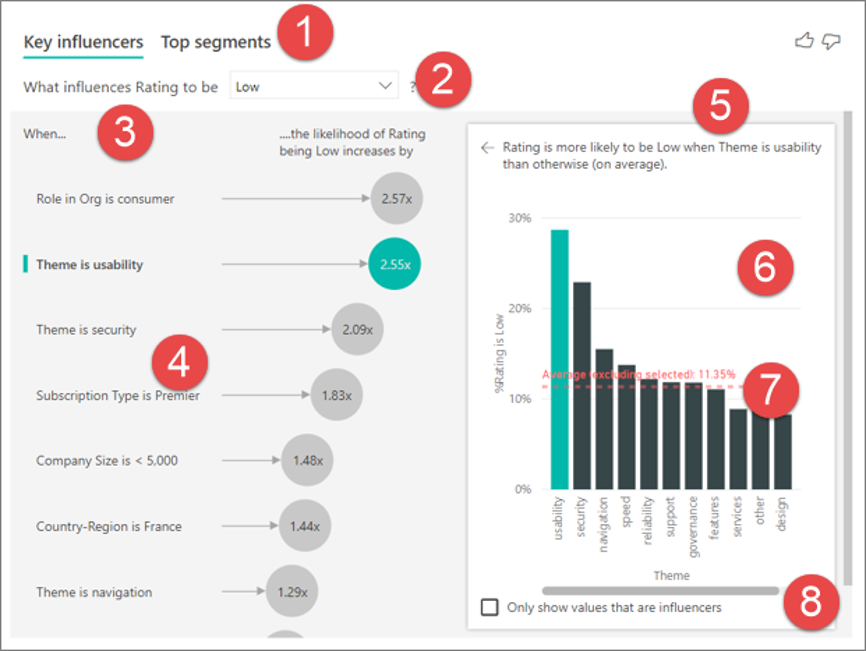
With the Key Influencers feature, users can now make the most of AI to glean insights from data as it has multiple visuals forged into one. Here is a look at the key influencer dashboard and the features it includes.

- Tabs: The key influencers visuals window comes with two tabs. The tab ‘Key Influencers’ shows the contributors to the selected metric value and the ‘Top segments’ tab shows the segments that contribute to the selected metric value the most. Each segment can contain several values.
- Drop-down box: The Drop-down box shows the value of the metric that is being looked into.
- Restatement: Restatement has two parts to it, one on the right pane and the other one on the left pane. The ‘Restatement’ feature helps users to comprehend what the visual is indicating.
- Left pane: The left pane is dedicated to showing a list of the top key influencers.
- Another Restatement area.
- Right pane: The right pane contains a graphic representation of the data.
- Average: The average is calculated for all possible values for the ‘Theme’ except the influencer that is selected.
- Checkbox: Check-box is a filtering option that displays the values of the selected influencers.
The key influencers visual is especially helpful to identify the factors affecting the metric being analyzed and contrasting the relative importance of these factors.
4. Building Your Own ML Models With Azure Machine Learning
With its AutoML function, Power BI now enables business analysts to develop custom machine learning models without having to code. Power BI uses automated machine learning features embedded in Azure Machine Learning to identify which models an analyst has permissions to and makes them accessible in an intuitive point and click user interface. With the help of this AI feature, collaborating with data scientists has become all the more easy for the analysts.
AutoML automates the data science part required for creating ML models. The guardrails integrated within it ensure the quality of ML models and improve visibility into the process users used to build their ML model.
With AutoML, you can create supervised machine learning techniques like Binary Prediction, Classification, and Regression Models for dataflows. Once an ML model is trained, a Power BI report showing the potential performance of your ML model is automatically generated. The report also explains the key influencers that impacted the prediction given by your model.
5. Power BI Chatbots
Though chatbots are not a default feature of Power BI, however, as a Microsoft Gold Partner, we have integrated chatbots with Power BI to simplify data access and consumption. Power BI chatbots enable users to retrieve data and obtain analytical insights from third-party messaging applications like Skype For Business, Slack, Skype etc., by simply asking questions in natural language. The bot, in turn, answers the question in the form of text or in a multimedia format (image, graphs, pie charts, etc.).
This helps decision-makers obtain valuable business insights and metrics without much effort, right from their actively used messaging application via chat. The simplicity that Power BI chatbots offer, eliminates the hassle of switching through multiple dashboards and filtering data manually.
If you’d like to learn more about Power BI, Tableau to Power BI Migration and the new AI features, please feel free to get in touch with one of our PowerBI consultants for a personalized consultation. We have helped several Fortune 500 and large enterprises in implementing Power BI and maximizing their investment from the system.


