Retail Business Intelligence Solutions Powered by AI

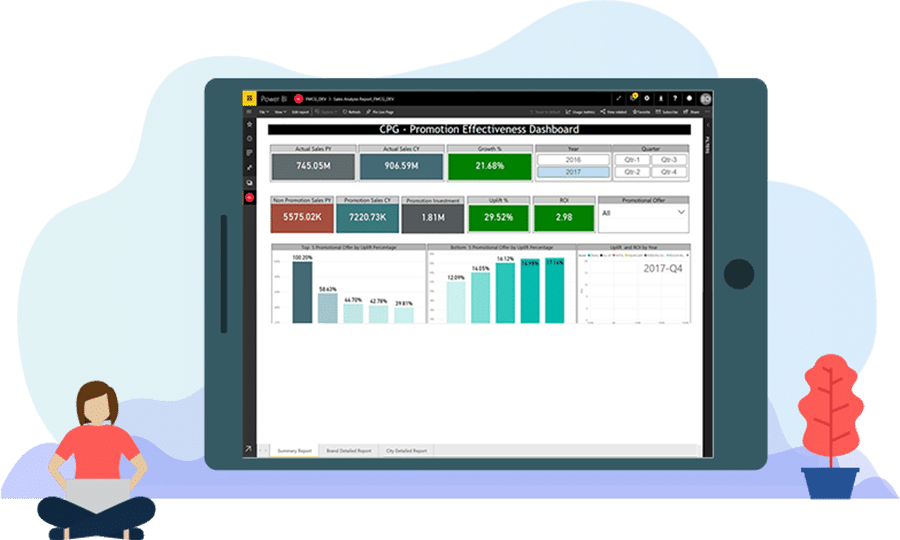
Unlock the power of data to boost sales and revenue. Run intelligent trade promotions and marketing campaigns with Big Data and Advanced Analytics.

Retail Business Intelligence Solution
Retail Industry

Business Intelligence and Advanced Analytics Solutions for Retail Industry

With Over 2.5 quintillion bytes of data is generated every day, one of the major challenges for retailers is to make this data useful and work. Compass BI and analytics for retail industry module comprises of a diverse set of solutions and services to ensure you are leveraging data for decision-making.

From strategy setting to data integration to AI-Powered analytics, we provide a unique and customizable blend of offerings to match your needs. Where to start is up to you

Our Retail BI Offerings

Underline

We believe in the motto of “making data actionable”. Everything we do is to help you become an analytical competitor and remould data into better sales and increase revenue. The below offerings are the most powerful as a suite but equally effective as separate entities.

Weather Data Integration

Data Integration
Services

Advanced Dashboards

Advanced
Analytics

Data-analytics-Manufacturing publishing image

Report Factory &
Support

Data Quality And Governance

Database
Services

Ai Powered Analytics

Self-Service BI

Mobile Bi

Mobile BI

Bi Chatbots

AI Chatbots

Key Differentiators

Underline

Retailers produce large amounts of data every second from multiple sources and most of this data is not harnessed effectively. Added to this most of this data is unstructured. Traditional retail BI and analytics software don’t support extensive capturing and processing of this data.
Some retailers are still dependant on spreadsheets and excel for key decision-making on trade promotions and marketing campaigns.

Compass leverages Big Data and AI technologies to not only capture real-time structured and unstructured data but also transforms it into meaningful insights.

Big Data Integration

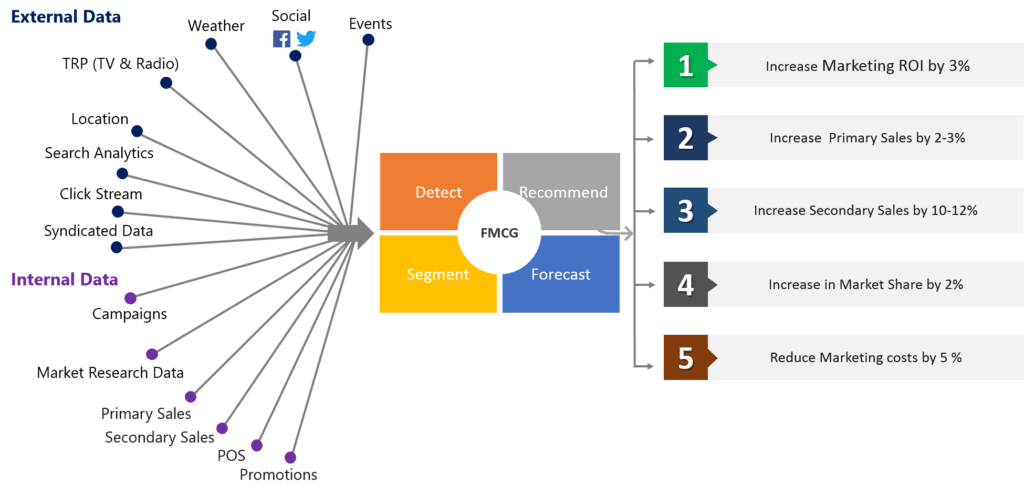
Capture data from multiple sources like POS, digital and social media, weather, events, past and competitor promotions etc.

Ai Powered Analytics
AI-Powered Analytics

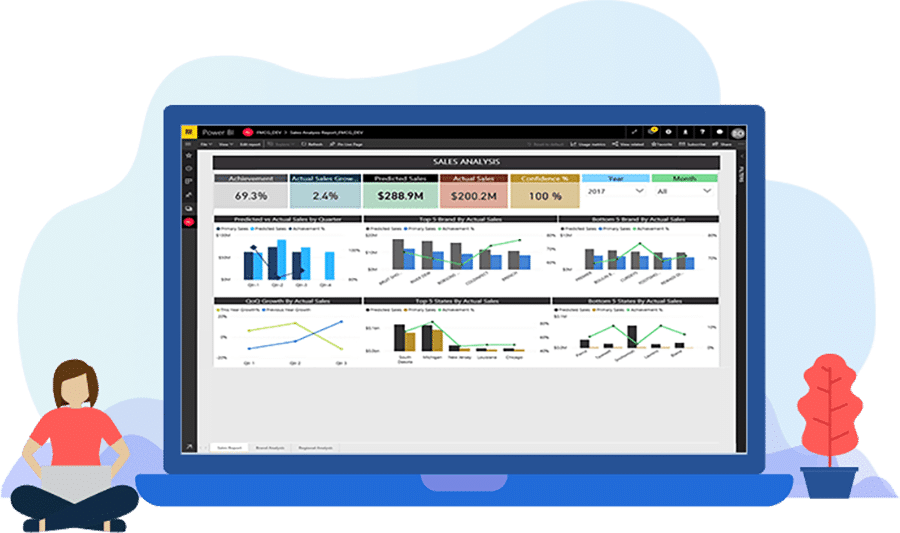
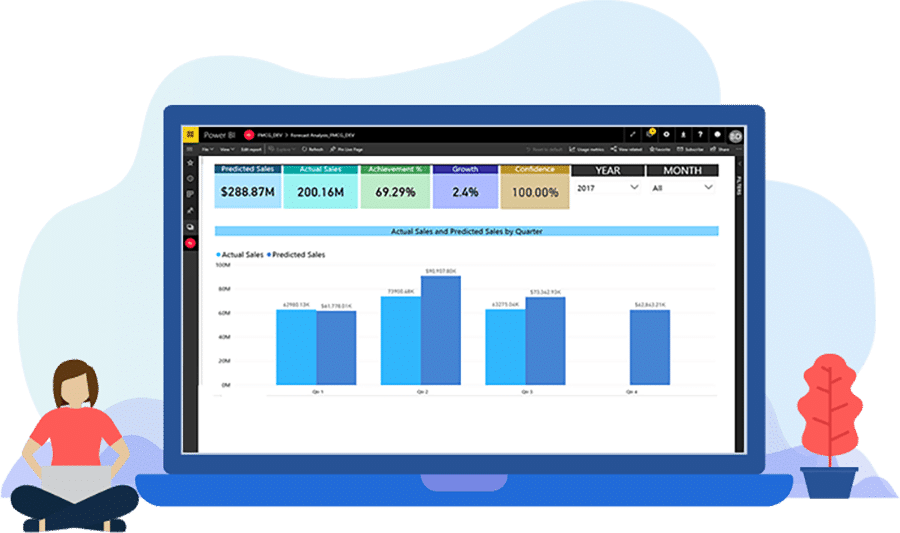
Advanced analytics like predictive and prescriptive analytics forecast recommend you what to do next by processing the data feeded.

Bi Chatbots
BI Chatbots

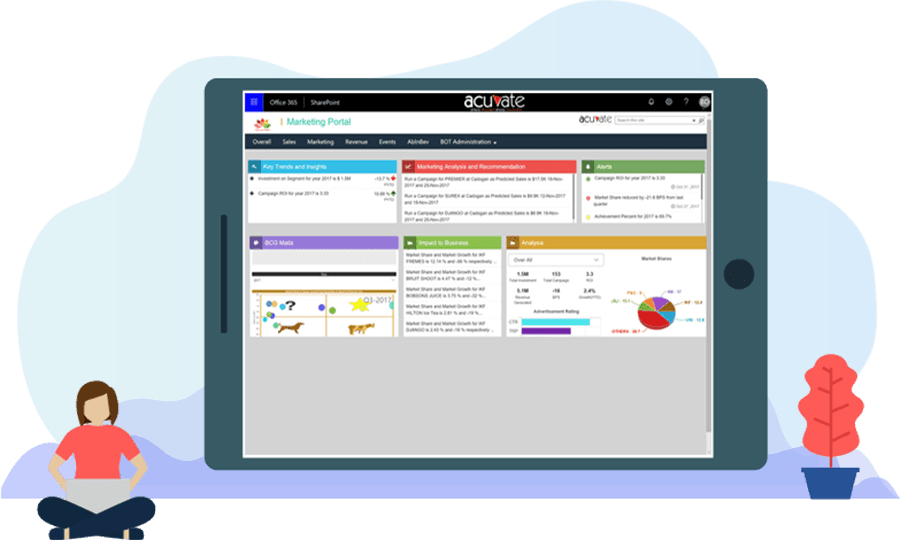
Our Business Intelligence chatbots for retail industry are enabled with AI and bring data straight to your messaging app. All you need to do is ask!

User Friendly Functioning
User-Friendly Functioning

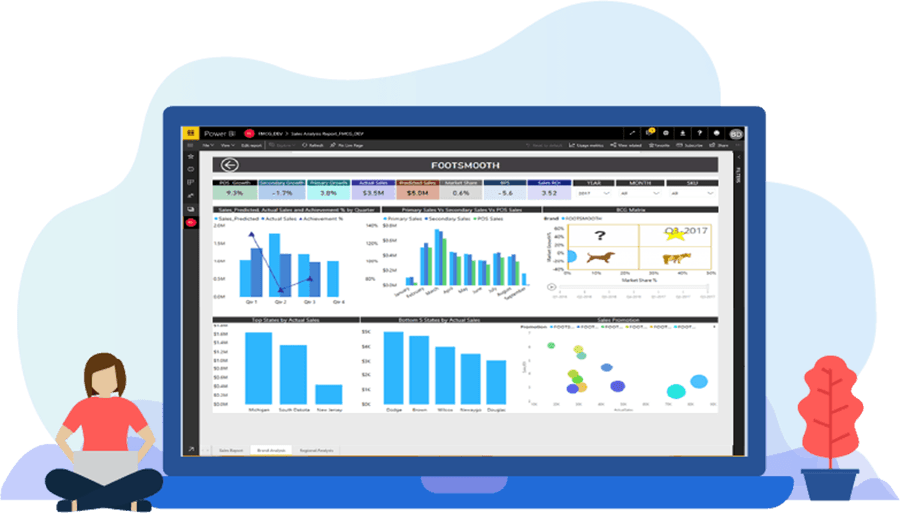
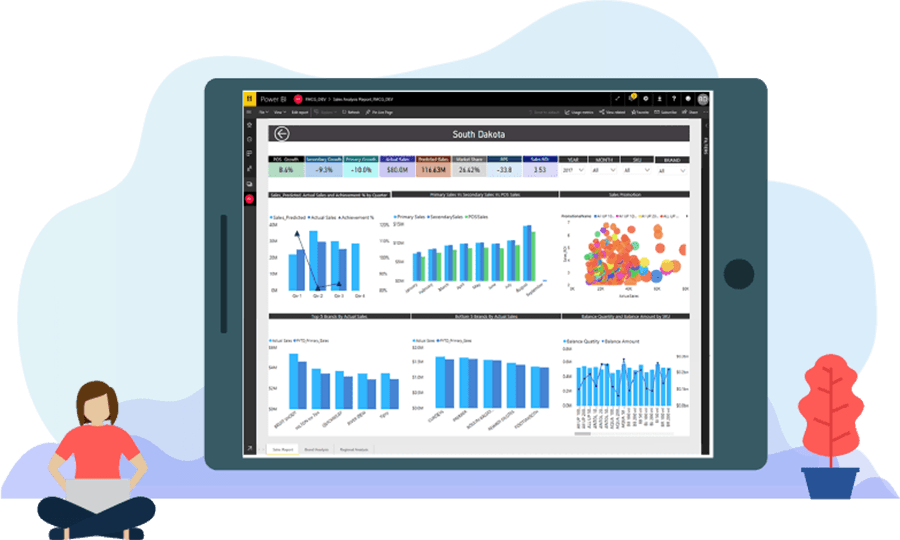
Say goodbye to spreadsheets! Our retail BI and analytics are easy to use, navigate and drill-down. See data as you wish to see with advanced visualizations.

Unified Data View
Unified Data View

Data available in siloed systems in another challenge for retailers. With Compass, you can get a single window view of all the different types of data.

Machine Learning
Machine Learning

Discover hidden growth opportunities and trends in data.

Retail BI and Analytics Benefits

Underline
Marketing
  • Run the right campaigns at the right time and place and for the right category, brand.
  • Invest the right amount for each campaign.
  • Discover new market and product segments.
  • Leverage data from digital and social media.
Sales Person
  • Measure trade promotion effectiveness.
  • Never go out of stock.
  • Detect OTIF losses and MSL non-compliance.
  • Optimize trade promotions better.
  • Understand how events and weather will affect sales.
  • Identify sales performance at a store level to identify areas of improvement to increase sales.
Revenue Management
  • Build what-if scenarios.
  • Find growth opportunities.
  • Build data-driven strategies.
  • Spend less time analyzing data.
  • Analyze store specific performance based on sales, promotions and expenses to improve revenue and margins.

Our Customers Around The World

Underline
Clientsv3 1

How it works?

Underline
Fmcg analysis

Dashboards

Underline

Transform your data into actionable Business Intelligence using our interactive dashboards. Monitor and compare important metrics, KPI’s and trends from a bird’s-eye view.

Build smart reports and interactive dashboards to identify the most profitable regions and brands. Get all essential data in charts, graphs and reports to interpret complex data and transform it into a powerful analytics solution.

With dashboard reporting, organizations will be able to make data-driven business decisions from rich visualizations that combine massive data sets into a single repository.

Results our clients witnessed

Underline
3% Increase in primary sales

Increase in
primary sales

12 %Increase in secondary sales

Increase in
secondary sales

2% Increase in market share

Increase in
market share

3% Increase in Marketing ROI

Increase in
marketing ROI

5% Decrease in Marketing costs

Decrease in
marketing costs

Our Exclusive Ebooks

Underline
Promotion

Driving Marketing Efficiency In The Consumer Goods Business With Advanced Analytics

Income

How an AI-Powered TPO Software can improve CPG Revenue Margins by 2%

Analytics

A CPG Revenue Management Officer’s Guide To Big Data and Advanced Analytics

Ai

How Is Artificial Intelligence Revolutionizing The CPG Business

Insights

Underline

Request a Demo

Underline

Subscribe to our monthly newsletter to get the latest updates directly to your mailbox!

2023 Acuvate. All rights reserved