Post promotion analytics for Consumer Goods and Retail companies

Measure promotion effectiveness, Optimize and Analyze trade spend and maximize the value of every dollar spent.
Post Promotion Analytics Banner
  • Trade promotions usually take up a large part of a CPG or retail organization’s revenue typically 15 to 20 %  but only about 20% of the companies can measure the performance of a promotion at an event level.
  • Decision-makers often face several challenges when performing promotion effectiveness analysis like data stored in siloed systems, reliance on spreadsheets, inability to detect and analyze key metrics etc., resulting in low ROI because of gut-based decisions instead of decisions based on metrics.
Tradepramotion Image

Our Customers Around The World

Underline
Clientsv3 1
Revenue Performance

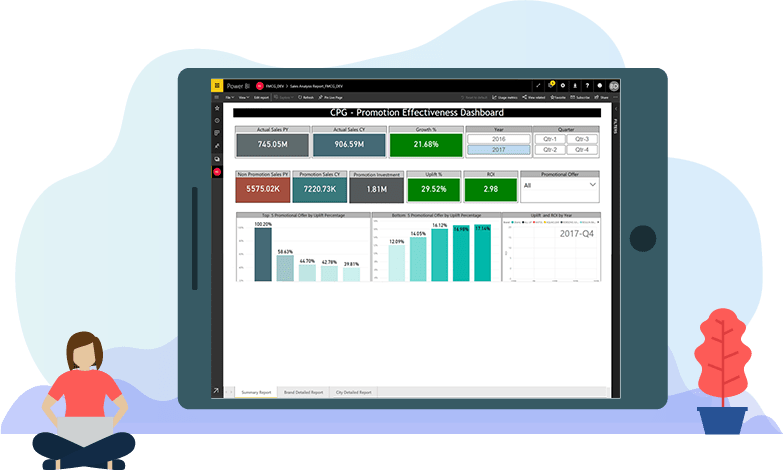
Compass is fused with AI, Machine Learning and Advanced Analytics to help you in accurately measuring trade promotion effectiveness, optimize your current promotions and plan for the future.

Compass Dashboard 5 Tab

What you can do with Compass’ Post promotion Analytics?

  • Analyse trade spend ROI for a different promotion, categories, retailers, locations etc.
  • Compare different promotions and know the top and bottom performing promotions.
  • Get sales uplift percent for each promotion.
  • Analyze promotion impact for each month, quarter and year.
  • Have a single window view of trade spend analysis data without switching different systems.
  • Compare post promotion analysis with competitors.

Our exclusive Ebooks

Underline
Promotion

Driving Marketing Efficiency In The Consumer Goods Business With Advanced Analytics

Income

How an AI-Powered TPO Software can improve CPG Revenue Margins by 2%

Analytics

A CPG Revenue Management Officer’s Guide To Big Data and Advanced Analytics

Ai

How Is Artificial Intelligence Revolutionizing The CPG Business

Advanced post promotion Analytics - Features

Underline

Compass captures real-time data from several internal and external sources to increase the accuracy of decision-making for CPG manufacturers and retailers. It helps you analyze if you have realized the maximum return for every dollar spent on a trade promotion. It is integrated with a “What-if” scenario builder to help you understand ROI before you actually run promotions.

Advanced Analytics

Predictive and Prescriptive Analytics for deeper and richer insights on post promotion analysis.

Machine Learning

Uncover hidden trends and information in your promotion data

Data Integration

Get a unified view of data from sources like POS, secondary and primary sales, competitors etc.

Trade Spend Analysis

Learn the yield per dollar spent on trade promotions.

Self-Service

You can create custom reports without depending on other teams

Sales Forecasting

Increase your promotion effectiveness by forecasting sales uplift and ROI.

Dashboards

Underline

Transform your data into actionable Business Intelligence using our interactive dashboards. Monitor and compare important metrics, KPI’s and trends from a bird’s-eye view.

Build smart reports and interactive dashboards to identify the most profitable regions and brands. Get all essential data in charts, graphs and reports to interpret complex data and transform it into a powerful analytics solution.

With dashboard reporting, organizations will be able to make data-driven business decisions from rich visualizations that combine massive data sets into a single repository.
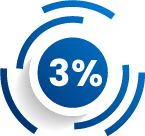
Results and Revenue Generated

Underline
3% Increase in primary sales

Increase in
primary sales

12 %Increase in secondary sales

Increase in
secondary sales

2% Increase in market share

Increase in
market share

3% Increase in Marketing ROI

Increase in
marketing ROI

5% Decrease in Marketing costs

Decrease in
marketing costs

Insights

Underline

Request a Demo

Underline

Subscribe to our monthly newsletter to get the latest updates directly to your mailbox!

2023 Acuvate. All rights reserved