POS Data Analysis Solutions For Retail And Consumer Goods Companies
Leverage AI-powered analytics to get meaningful insights from real-time POS data and beyond. Know your customer, enhance your decision-making, and run high-yield promotions.


Leverage AI-powered analytics to get meaningful insights from real-time POS data and beyond. Know your customer, enhance your decision-making, and run high-yield promotions.

Point of Sales data analysis is a key element for manufacturers and retailers to understand shopping trends, consumer behavior and basket level insights. With Acuvate’s Compass, you can not only capture and powerfully analyze your POS data but also integrate the data with other data sources to improve decision-making accuracy.
Compass transforms raw POS data into granular prescriptions with Advanced Analytics. You can spend less time analyzing data and more time taking decisions.
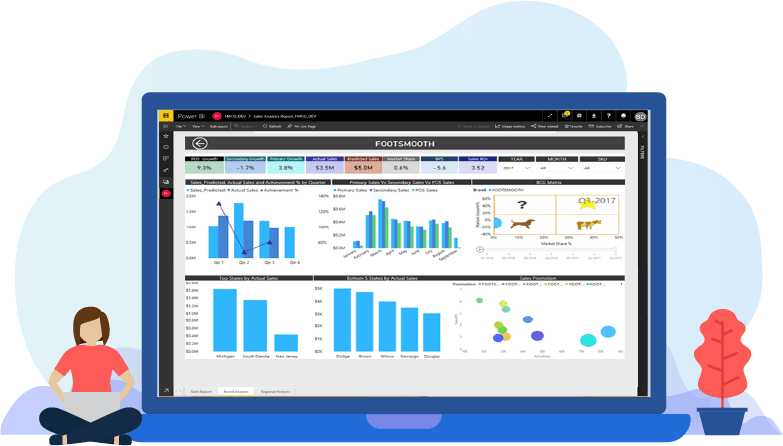
Better decisions need better data. Even though POS data is an important source of information of CPG manufacturers and retailers, it is not the only one. Data-driven decisions are built when the sources are more.
In addition to Point of Sales data, Compass can also be integrated with:
Internal sources – POS, past promotions, Primary and secondary sales, Market research data etc.
External sources – Syndicated data, Digital media, Competitors, weather, social media, events, Location, TRP etc.
Powered with predictive and prescriptive analytics to provide recommendations from data
Get deep insights on shopping behaviours with a very less analysis.
Understand shopping behaviours by utilizing data from multiple sources.
Change the way you interact with data for faster decision-making.
Unlike traditional POS analytics softwares which have old POS data, Compass is updated with fresh real-time data.
Use your existing POS data to plan for future promotions and predict ROI.
Invest the right amount in the right promotions
Get basket-level analysis based on consumer buying trends
Better inventory management and lesser operational costs
Drive long-term and short-term revenue and increase margins
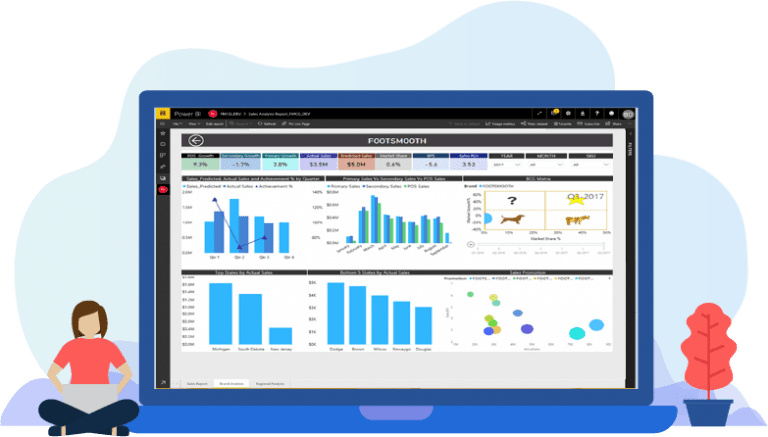
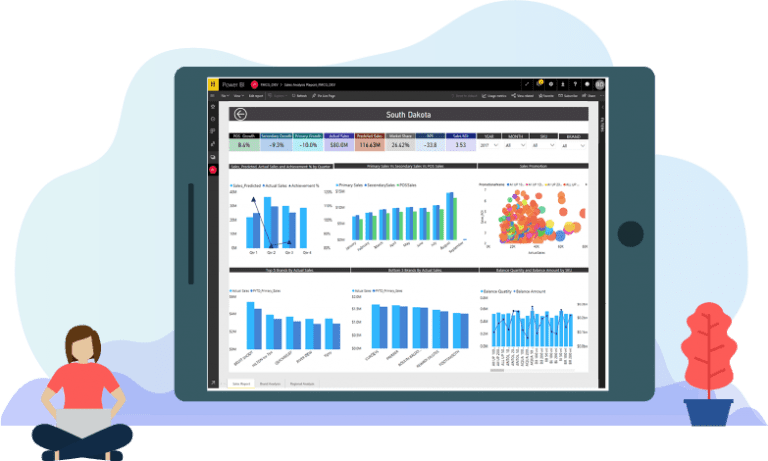
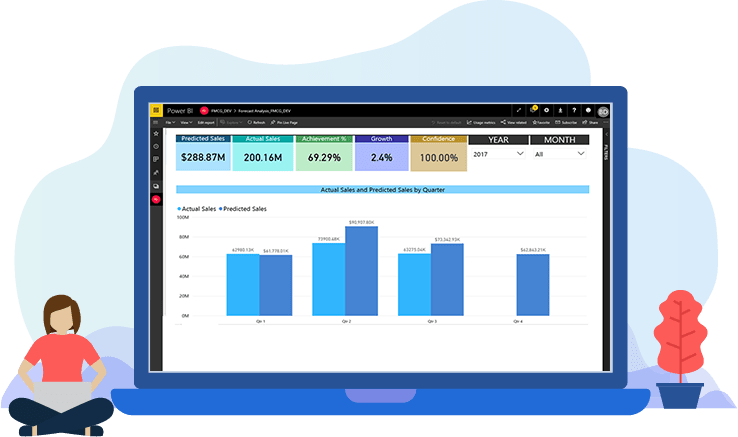
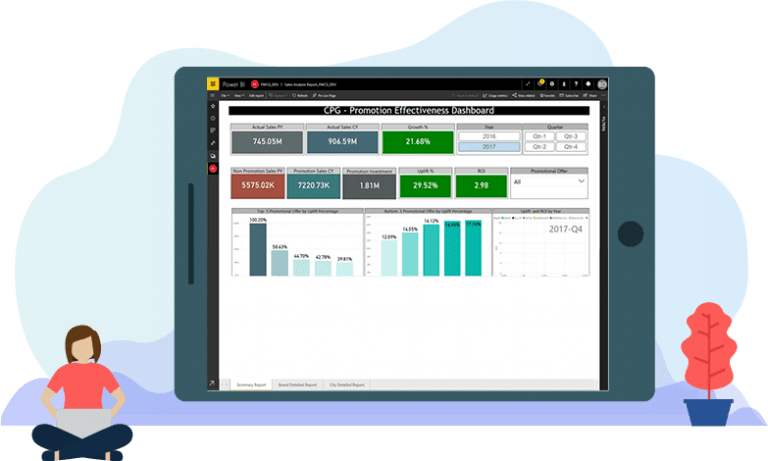
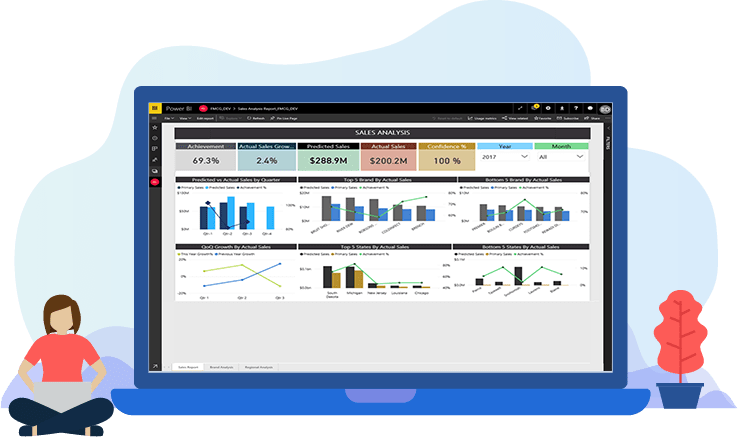
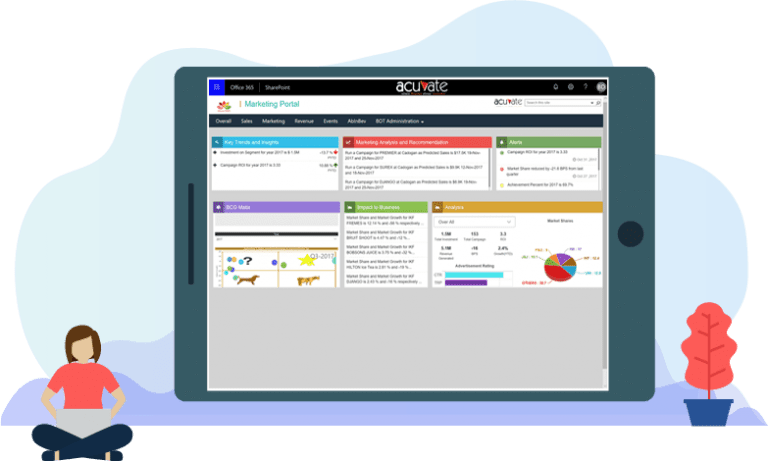
Transform your data into actionable Business Intelligence using our interactive dashboards. Monitor and compare important metrics, KPI’s and trends from a bird’s-eye view.
Build smart reports and interactive dashboards to identify the most profitable regions and brands. Get all essential data in charts, graphs and reports to interpret complex data and transform it into a powerful analytics solution.
With dashboard reporting, organizations will be able to make data-driven business decisions from rich visualizations that combine massive data sets into a single repository.


Subscribe to our monthly newsletter to get the latest updates directly to your mailbox!