AI-Powered Trade Promotion Optimization Software For An Intelligent Revenue Management


– Nielsen Holdings

– Booz Allen Hamilton
– Nielsen Holdings
– Economic Times Retail
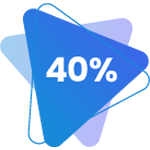
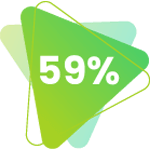
CPG and retail companies allocate a major part of their market budgets to trade promotions. However most trade promotions today’s don’t yield the needed ROI. This has a huge impact on your organizational revenue.
Revenue management teams across the globe struggle to:
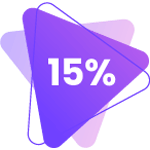
A mere 10-15% improvement in promotion ROI can significantly boost your bottom line and overall revenue.
Compass is an AI-powered trade promotion optimization (TPO) software built for revenue management and marketing executives. It helps you not only measure and optimize your trade promotions but also forecast sales. Maximize the value of every dollar you spend on promotions!



Your promotions’ performance is impacted by various casual factors. We help you integrate and harmonize high-quality data from various internal and external sources.

Leverage what-if scenarios to predict promotion outcome without actually running it. Forecast sales by defining promotional combinations using constraints like promotion type, budget and time and objectives like revenue, profit, volume, etc

Measure the effectiveness, ROI and sales uplift generated by promotions. Identify your top and under-performing promotions. Automate the entire post-promotion analysis process.

Experience the power of AI in data analysis. Get recommendations on which type of promotions to run, where, when and for which products. Get real-time alerts on your promotion performance.

Integrate Compass with your existing TPM and ERP systems to have one centralized system of intelligence. Plan, manage, measure and optimize your trade promotion with a unified interface.

Ensure faster user adoption with chatbots, intuitive dashboards, data visualizations, self-service reporting and more!
Transform your data into actionable Business Intelligence using our interactive dashboards. Monitor and compare important metrics, KPI’s and trends from a bird’s-eye view.
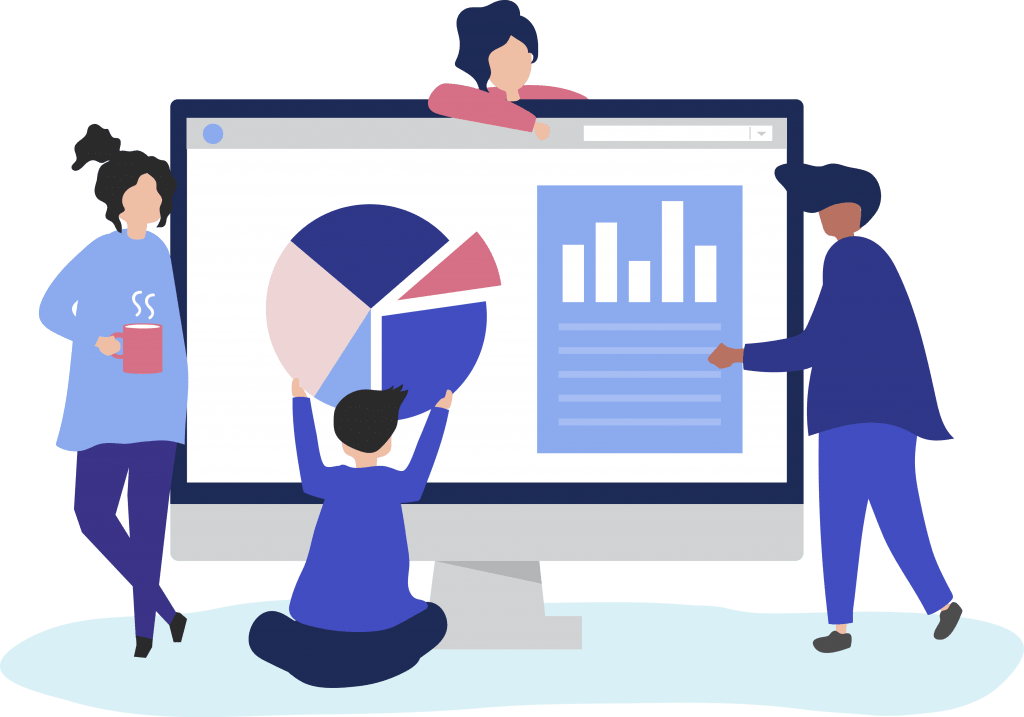
Build smart reports and interactive dashboards to identify the most profitable regions and brands. Get all essential data in charts, graphs and reports to interpret complex data and transform it into a powerful analytics solution.
With dashboard reporting, organizations will be able to make data-driven business decisions from rich visualizations that combine massive data sets into a single repository.
Subscribe to our monthly newsletter to get the latest updates directly to your mailbox!