Simplify and enhance the way you consume critical organizational data with our data visualization services


Data is the oil of the 21st century and set to grow at an unprecedented rate.
However, it is also crucial to present this data in a comprehensible way. Decision-makers and top-level management need to monitor key trends and track KPIs of different brands, locations, categories etc. without much effort on drilling down dashboards or searching for insights on spreadsheets.
Our data visualization service offerings include building pixel-perfect reports and interactive dashboards according to your business needs. Our solutions are tailored to your requirements and the KPIs you’d like to track. We also enable self-service reporting to reduce your dependency on IT or MIS teams.


Reporting needs vary for different business users based on their roles. For instance, CXOs need KPIs across departments and functions. We develop custom and relevant reports and dashboards for each user role.
A majority of organizations still depend on spreadsheets to track data and reporting. This is an expensive process and hinders decision-making. With advanced data visualizations you can visualize real-time data in different formats and unlock the value of data.
It enables you to drill down the information to look at results from multiple angles. For example, you can break down your advertising ROI for a quarter by channel and understand which ones are underperforming.
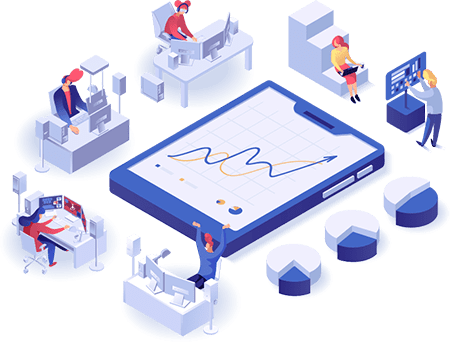
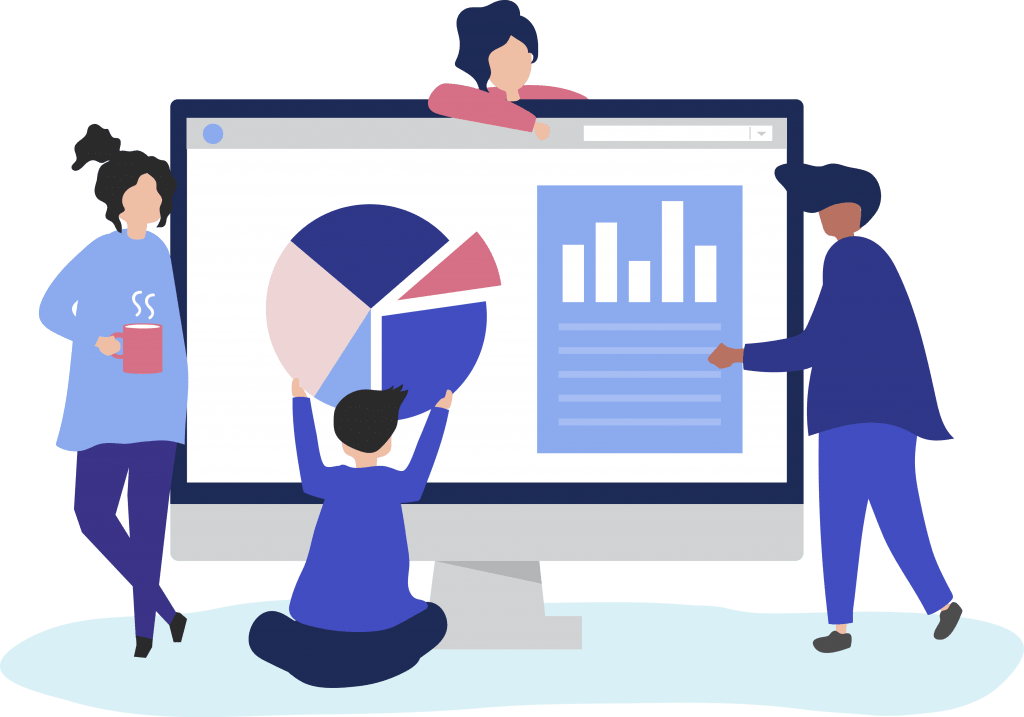
Our data visualization services enable easy digestion of data allowing users to make sense of large data sets with graphical charts, tables, informative graphs, maps etc.
Compass lets all decision makers access required information and insights without having to depend on the IT department. It gets them the data they need on the go and makes your company a truly data-driven organization.
Compass reviews your existing data visualization model and helps in improving the solution. We also can build a customized solution from scratch based on your requirements and preferred technology stack.
With 50+ BI and Analytics implementations, Compass is regarded as a leader in the Business Intelligence and analytics space. We are a strategic partner with some of the top BI companies like Microsoft and worked with other visualization tools.
Compass data visualization reports go beyond the desktop compatibility. Reports with rich visualizations can be accessed across all mobile devices. Top management can monitor KPIs on the go.
Besides an initial training on the tool’s features and functions, Compass also provides maintenance and support to drive user adoption and ensure the system is fully leveraged within your organization.
Acuvate’s Compass is a trade promotion optimization solution built exclusively for CPG and Retail companies. Compass leverages our data visualization capabilities to let revenue management and sales teams easily spot trends and outliers in trade promotions.
Transform your data into actionable Business Intelligence using our interactive dashboards. Monitor and compare important metrics, KPI’s and trends from a bird’s-eye view.
Build smart reports and interactive dashboards to identify the most profitable regions and brands. Get all essential data in charts, graphs and reports to interpret complex data and transform it into a powerful analytics solution.
With dashboard reporting, organizations will be able to make data-driven business decisions from rich visualizations that combine massive data sets into a single repository.
Subscribe to our monthly newsletter to get the latest updates directly to your mailbox!