
Consumer goods companies are increasingly realizing the value of leveraging data and driving well-informed decision making that is grounded in insights derived from data. Several thousands of dollars are invested into purchasing syndicated data from data brokers such as Nielsen, IRI, and others.
However, this data is actually not leveraged to generate the desired return on investment (ROI).
Ironically, organizations investing a substantial amount of money to subscribe to major data providers such as Nielsen, and enlisting an analyst team to build reports using Excel Spreadsheets and Macro, are actually wasting both time and resources. Instead of building exhaustive reports, time and effort should be spent on analyzing the information/data.
Also, it is quite arduous to integrate a company’s sales and financial data, which means important insights often go missing. The end reports being generated, unfortunately, do not provide sufficient insights to make well-informed decisions. Or, your team is forced to resort to mind-numbing switching from one worksheet tab to the next to gain a more holistic understanding.
When it comes to BI, it’s all about the business user. Using old tools that only data scientists, BICC or the IT can understand and access is passé. Can you even imagine being able to afford to spend weeks or months to prepare a report? The need of the hour, especially in the current fast paced environment is to equip every business with the power to obtain intelligent insights in as little time as possible.
But there is a way better way to do it, and we will be discussing these in further detail in this post:
If you want answers and insights that will impact your business bottom line, then Acuvate’s is for you.
- Increase your market share and maximize your returns from Nielsen’s investment.
- Turn Nielsen Data into actual Information to give your sales and marketing teams better insights
- Enable your teams to take educated decisions by leveraging powerful dashboards
- This solution features a data model and ETL ready built which allows you to integrate the Nielsen data into a Data Mart and pre built reports with capabilities of advanced visualization
Have A business Intelligence Project in Mind?
Acuvate is regarded as a global leader in the BI services spaces
Essentials Of A Self-Service BI
Organizations across the world have expressed keen interest in self-service business intelligence and have made it a high priority. As business users expect increased flexibility and autonomy in reporting and analytics, the demand for self-service BI has grown by leaps and bounds. Efficient data discovery and self-service are going to revolutionize the way organizations approach business intelligence in the future. With the help of advanced data visualization tools, businesses are now able to obtain newer levels of details.
Let’s take a look at what components are essential to self-service BI:
The ability to create and modify existing data models and pre-built models
The idea of self-service BI is that it should enable power users and business analysts to modify or create data models on their own. Essentially, business users do not have to rely on IT or BI team to do their data modeling, and instead be able to tailor data model to suit their specific business department’s needs. This modeling can happen in a metadata layer, a database, or even in a ‘sandbox’ environment. Organizations must have an internal discussion to determine the best data management strategy for their business.
The Self Service BI capability enables the integration of internal data from LOB systems to obtain deeper insights. This also enables you to become more agile using Nielsen data in-house, instead of depending on expensive and tedious services to improve your market shared.
An efficient self-service capability is also designed to be used for both power and non-power users. While non-power users should have dynamic reports and dashboards, power users require flexibility and functionality for their daily work with data to address their business challenges.
- Mobile BI
Over 42% of companies will plan to deploy Mobile BI. Strategize and implement Mobile BI in order to ensure that the CXO’s get access to the right KPIs to monitor and take decisions on the go. It is also imperative to ensure that the field teams have access to operational reports. Using technologies such as Birst Mobile, Power BI and SQL server reporting services for mobile enables effective decision making, equipping business users with the right information at the right time.
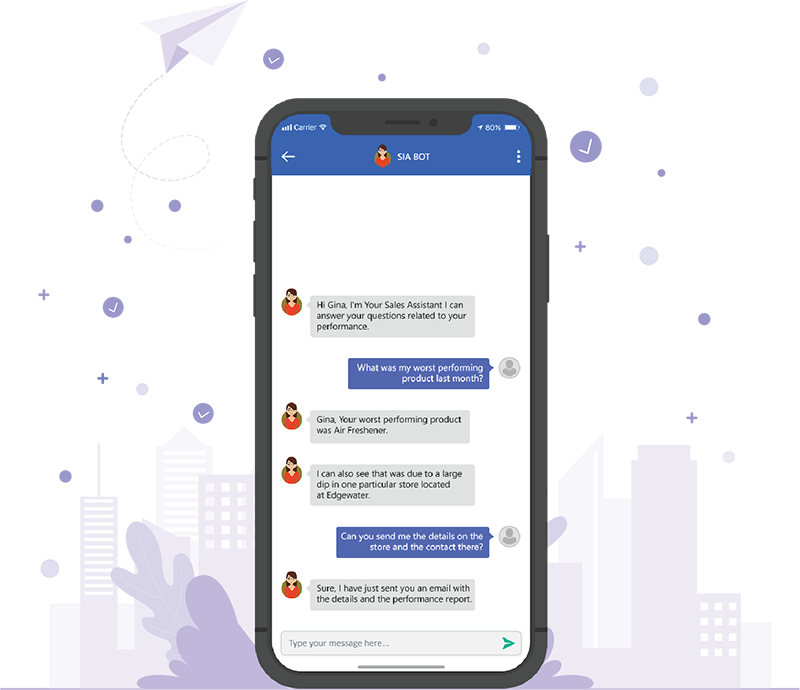
- Chatbots
BI Chatbots are taking self-service to the next level! Of all the artificial intelligence technologies making a wave across the globe, chatbots have got to be the most prominent one currently. Users can ask natural language questions to have their questions answered. Chatbots also allow for effortless data access, as users don’t have to switch between multiple dashboards to arrive at the data and conclusions they truly need. Chatbots essentially bring alive the purpose of self-service BI in its truest sense and make incredibly fast decision making a real possibility.
Advanced Visualization
Advanced data visualization software provides a variety of ways to view data -including visuals such as bubble charts, heat maps, and so on. When used correctly, visualization greatly simplifies and the process of analyzing massive data sets and can offer a wealth of business insights at a much faster pace than traditional BI tools.
When approaching a third party vendor to help you with advanced visualization, it is important that they understand your business intimately and are aware of your business goals and priorities and are leveraging this knowledge to implement actionable BI by identifying relevant KPIs. Drilling down on these KPIs to take actionable decisions will enable you to make better business decisions. This involves the use of appropriate visualization for various charts which further enables decision making and advanced visualization by using technologies like D3, Qlik Sense, Birst Visualizer etc.
Acuvate’s Self Service BI Capability allows you to integrate internal data from your LOB systems to get better insights. This further enables you to be more agile in using Nielsen data in-house and not rely on a time consuming and costly service for you to take decisions on improving your market share.
If you’d like to learn more about this topic, please feel free to get in touch with one of our experts for a personalized consultation.
FREE EBOOK
A CPG REVENUE MANAGEMENT OFFICER’S GUIDE TO BIG DATA AND ADVANCED ANALYTICS


